Problems In Benchmark Land
In this post I describe the benchmark system I use to monitor the performance of
the Rust null block driver implementation, rnull. I also cover a problem with
the benchmark results that manifested during testing for v6.12-rc2.
The benchmark system is an important tool for determining performance of things such as LTO and changes to the code base in general. When there is too much noise in the results, it is not possible to reason about the performance impact of changes. Thus, it is important that the system produce a stable output that can be used for statistical inference.
Benchmark Setup
After rebasing downstream rnull on a new -rc or stable release, I run a series
of benchmarks on null_blk (the C null block driver) and rnull. This is to
ensure I do not introduce any performance regressions, and to monitor the
general performance of the driver over time.
The configuration space I test is as follows:
- Queue depths 1, 8, 32, 128
- Block size 4 KiB, 32 KiB, 256 Kib, 1 Mib, 16 MiB
- Workloads: Random read, random write,
- Parallel jobs: 1, 2, 6
The values are picked to cover as large an area as possible in a limited time. The hardware available to execute the tests are 4 nodes with the following configuration:
- ASRock Rack B650D4U server board
- AMD Ryzen 5 7600 CPU
- 32 GB 4800 MT/s DDR5 on one channel
The benchmark sequence is the following:
- Build a kernel to test.
- Boot a machine with said kernel.
- Set the
performancegovernor forcpufreq. - Repeat the following sequence 40 times:
- Load and configure the kernel module under test (
null_blkorrnull_mod).- Configure a 4 GiB memory backed drive with direct completions.
- Prep the simulated device by writing all 4 GiB.
- This makes the driver allocate the backing memory for the device. We do not want to benchmark the memory allocator.
- Run the workload on the simulated device.
- Unload the module.
- Load and configure the kernel module under test (
- Shut down the machine
When running the workload, jobs are pinned to CPU cores by passing
--cpus_allowed_policy=split and --cpus_allowed=0-N to fio. N is replaced
by the number of jobs.
The reason for the high repeat count is to be able to model the sample mean with a t-distribution and achieve somewhat reasonable confidence intervals. This statistic is valid when the samples are independent. As we shall see later, this is not always the case.
The execution time for the test sequence is around 50 hours. The sequence is executed for both the C driver and the Rust driver.
I use fio as the workload generator.
I wrote a small script called
fio-matrix to execute the test
matrix. The configuration I use for fio-matrix to execute the above test
matrix is:
prep = true
samples = 40
runtime = 30
ramp = 10
cpufreq = true
jobcounts = [ 1, 2, 6 ]
workloads = [ "randread", "randwrite" ]
block_sizes = [ "4k", "32k", "256k", "1m", "16m" ]
queue_depths = [ 1, 8, 32, 128 ]
capture = true
For rnull I use additional config:
device = "rnullb0"
module = "rnull_mod"
module_args = [ "memory_backed=1", "param_memory_backed=1" ]
modprobe = true
module_reload_policy = "Always"
And for null_blk:
device = "nullb0"
module = "null_blk"
module_args = [ "nr_devices=0" ]
modprobe = true
configure_c_nullblk = true
module_reload_policy = "Always"
Running the benchmarks in a virtual machine gives a lot of noise in the results,
so the benchmarks are running on bare metal. I use a stripped down NixOS 24.05
configuration with a custom kernel. The kernel config I use was originally based
on a upstream Debian config that I stripped down with localmodconfig. It is
pretty generic except I configure CONFIG_PREEMPT_NONE=y.
Post Processing
To render the figures that I post on the website, I do a point estimate of the difference of the means of each configuration point for the two drivers. When the samples of each configuration point are independent, we can model the sample mean, and the difference of the sample means for the two drivers, with a t-distribution.
The Problem
This method outlined above has yielded fairly consistent results over the past
year. However, when I was running the results for both rnull and rnvme for
6.12-rc2, I observed some strange outliers in the comparison between the Rust
driver and the C driver.
I poked around a bit and thought I better run the full benchmark again. This is
when I saw a 30% difference in one of the configuration points for two runs of
the same commit of the same driver. This was for two runs of the rnull driver
on the configuration point at queue depth 8, 2 jobs, 256 KiB IO size, random read.
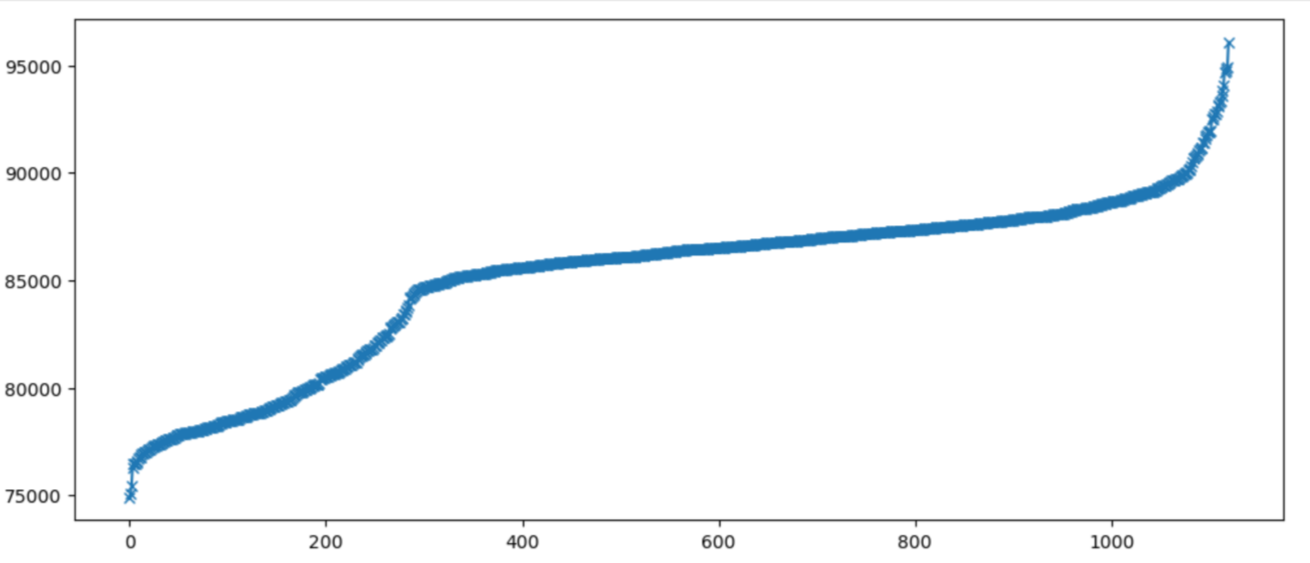
I decided to to look at the individual samples for this configuration. For the first run:
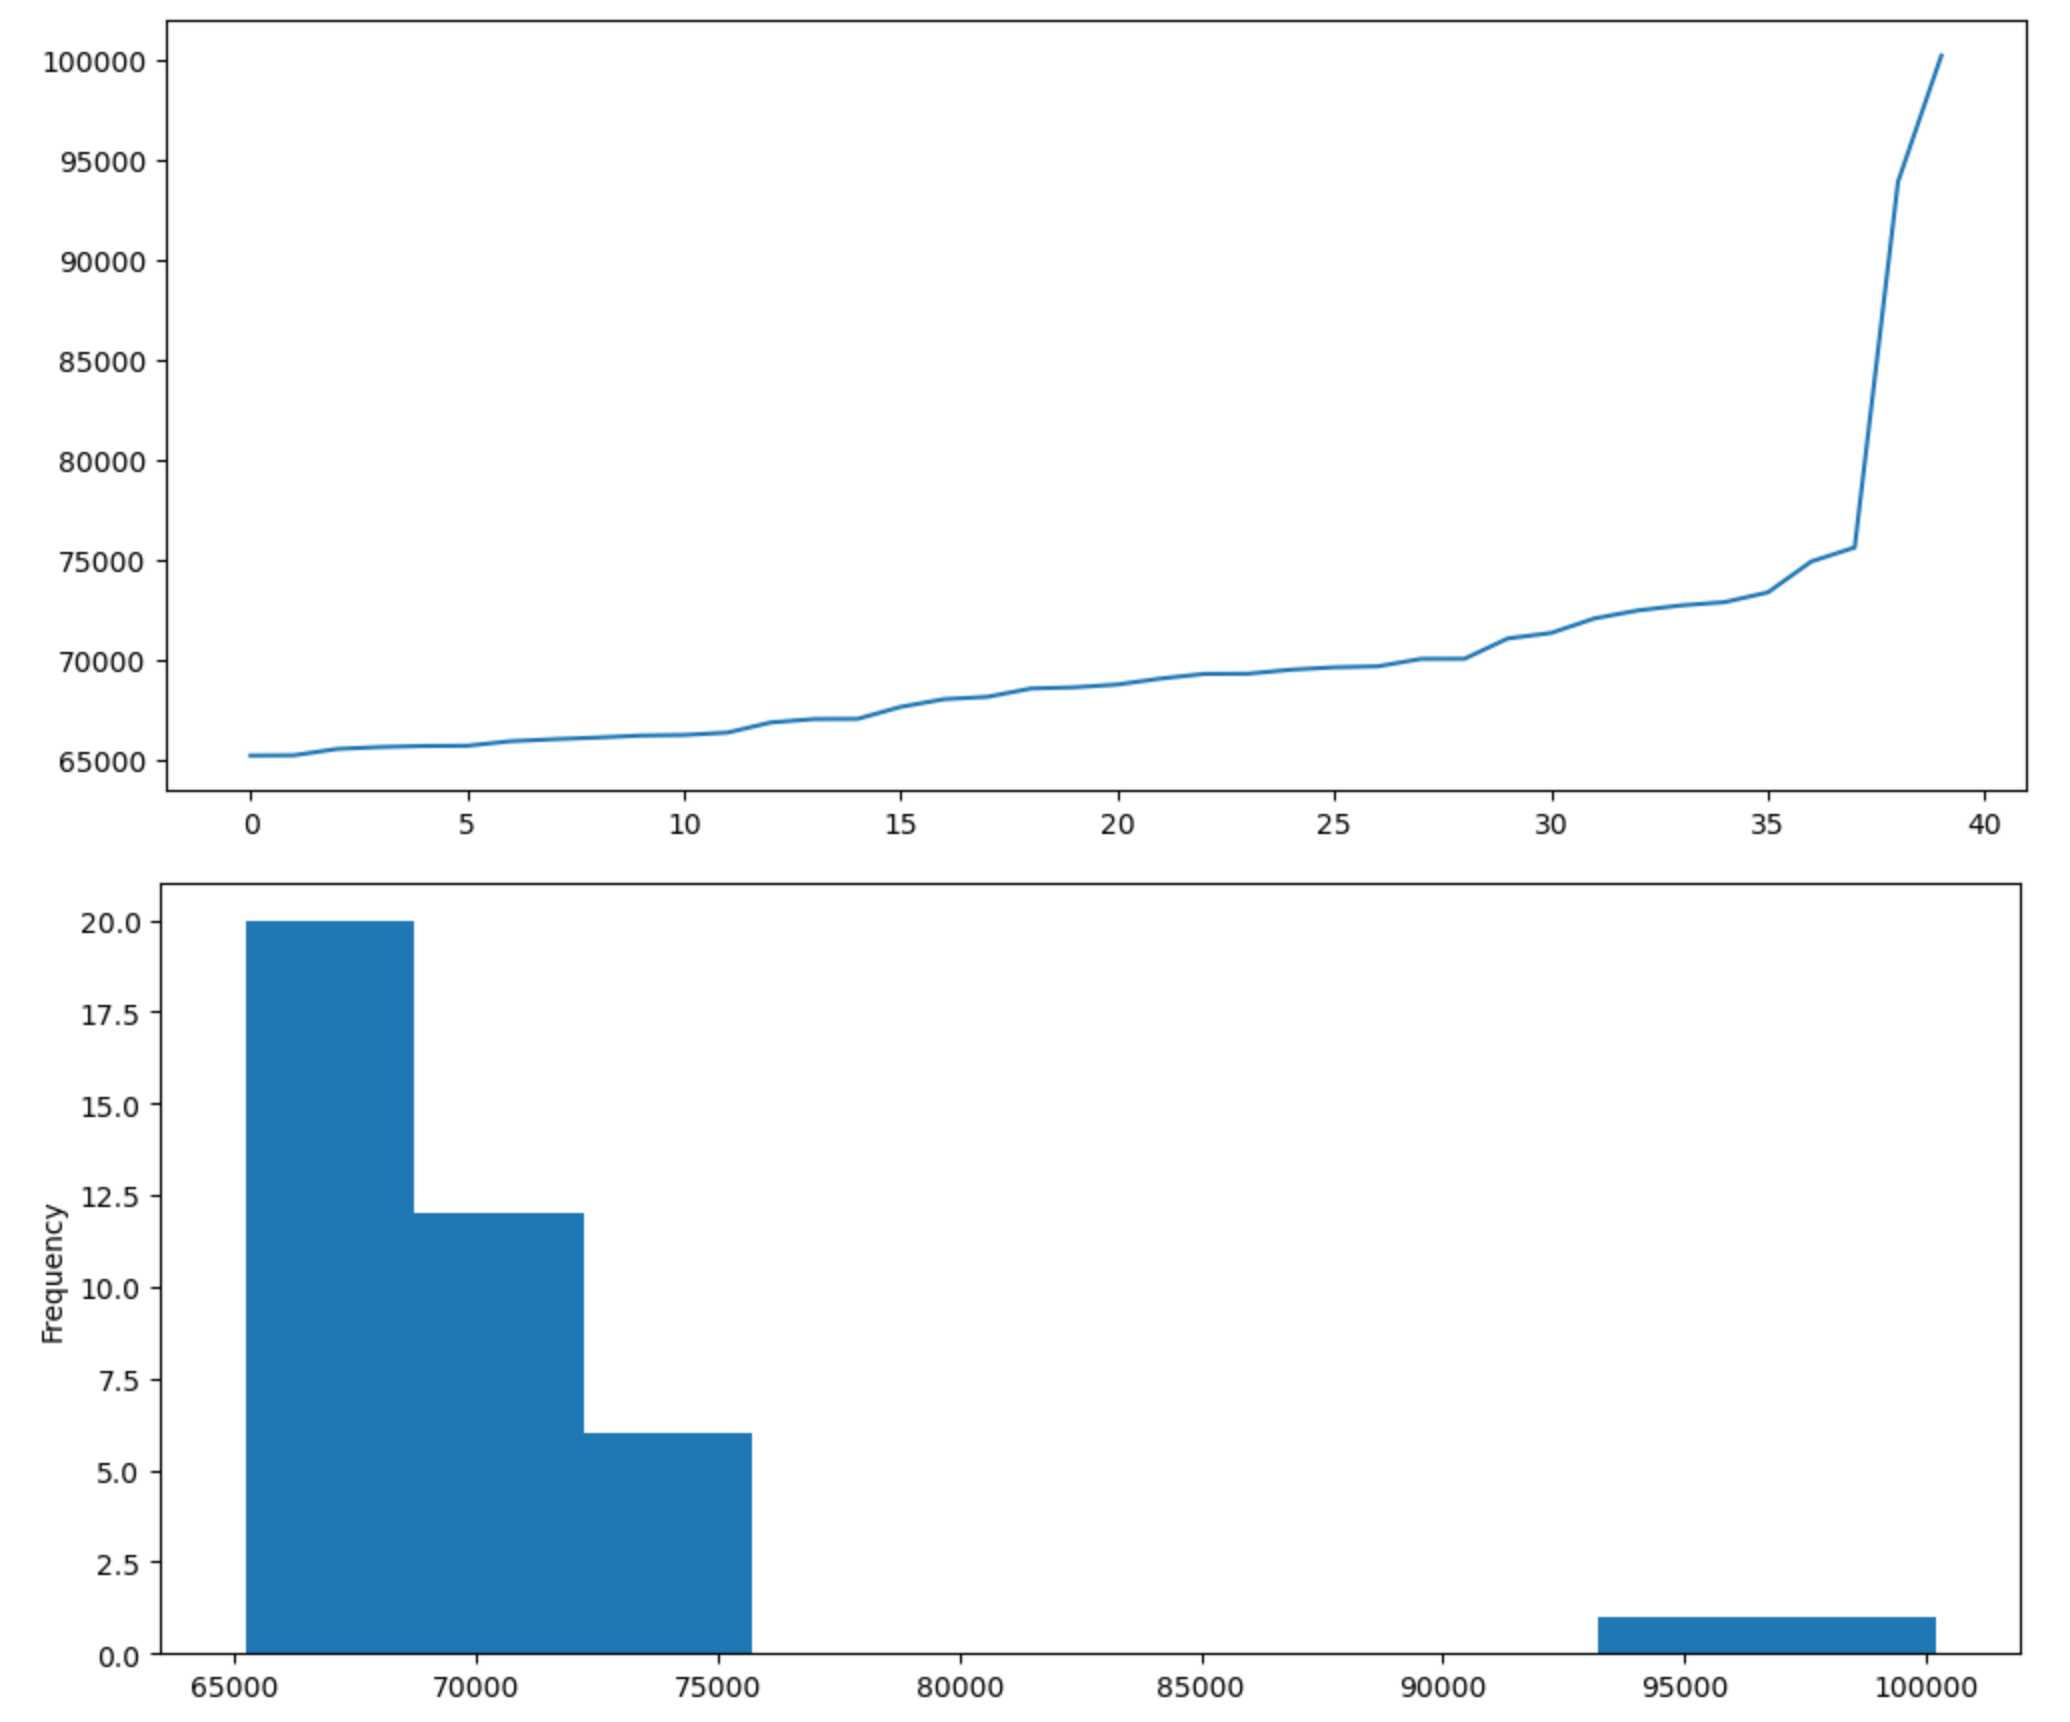
And for the second run:
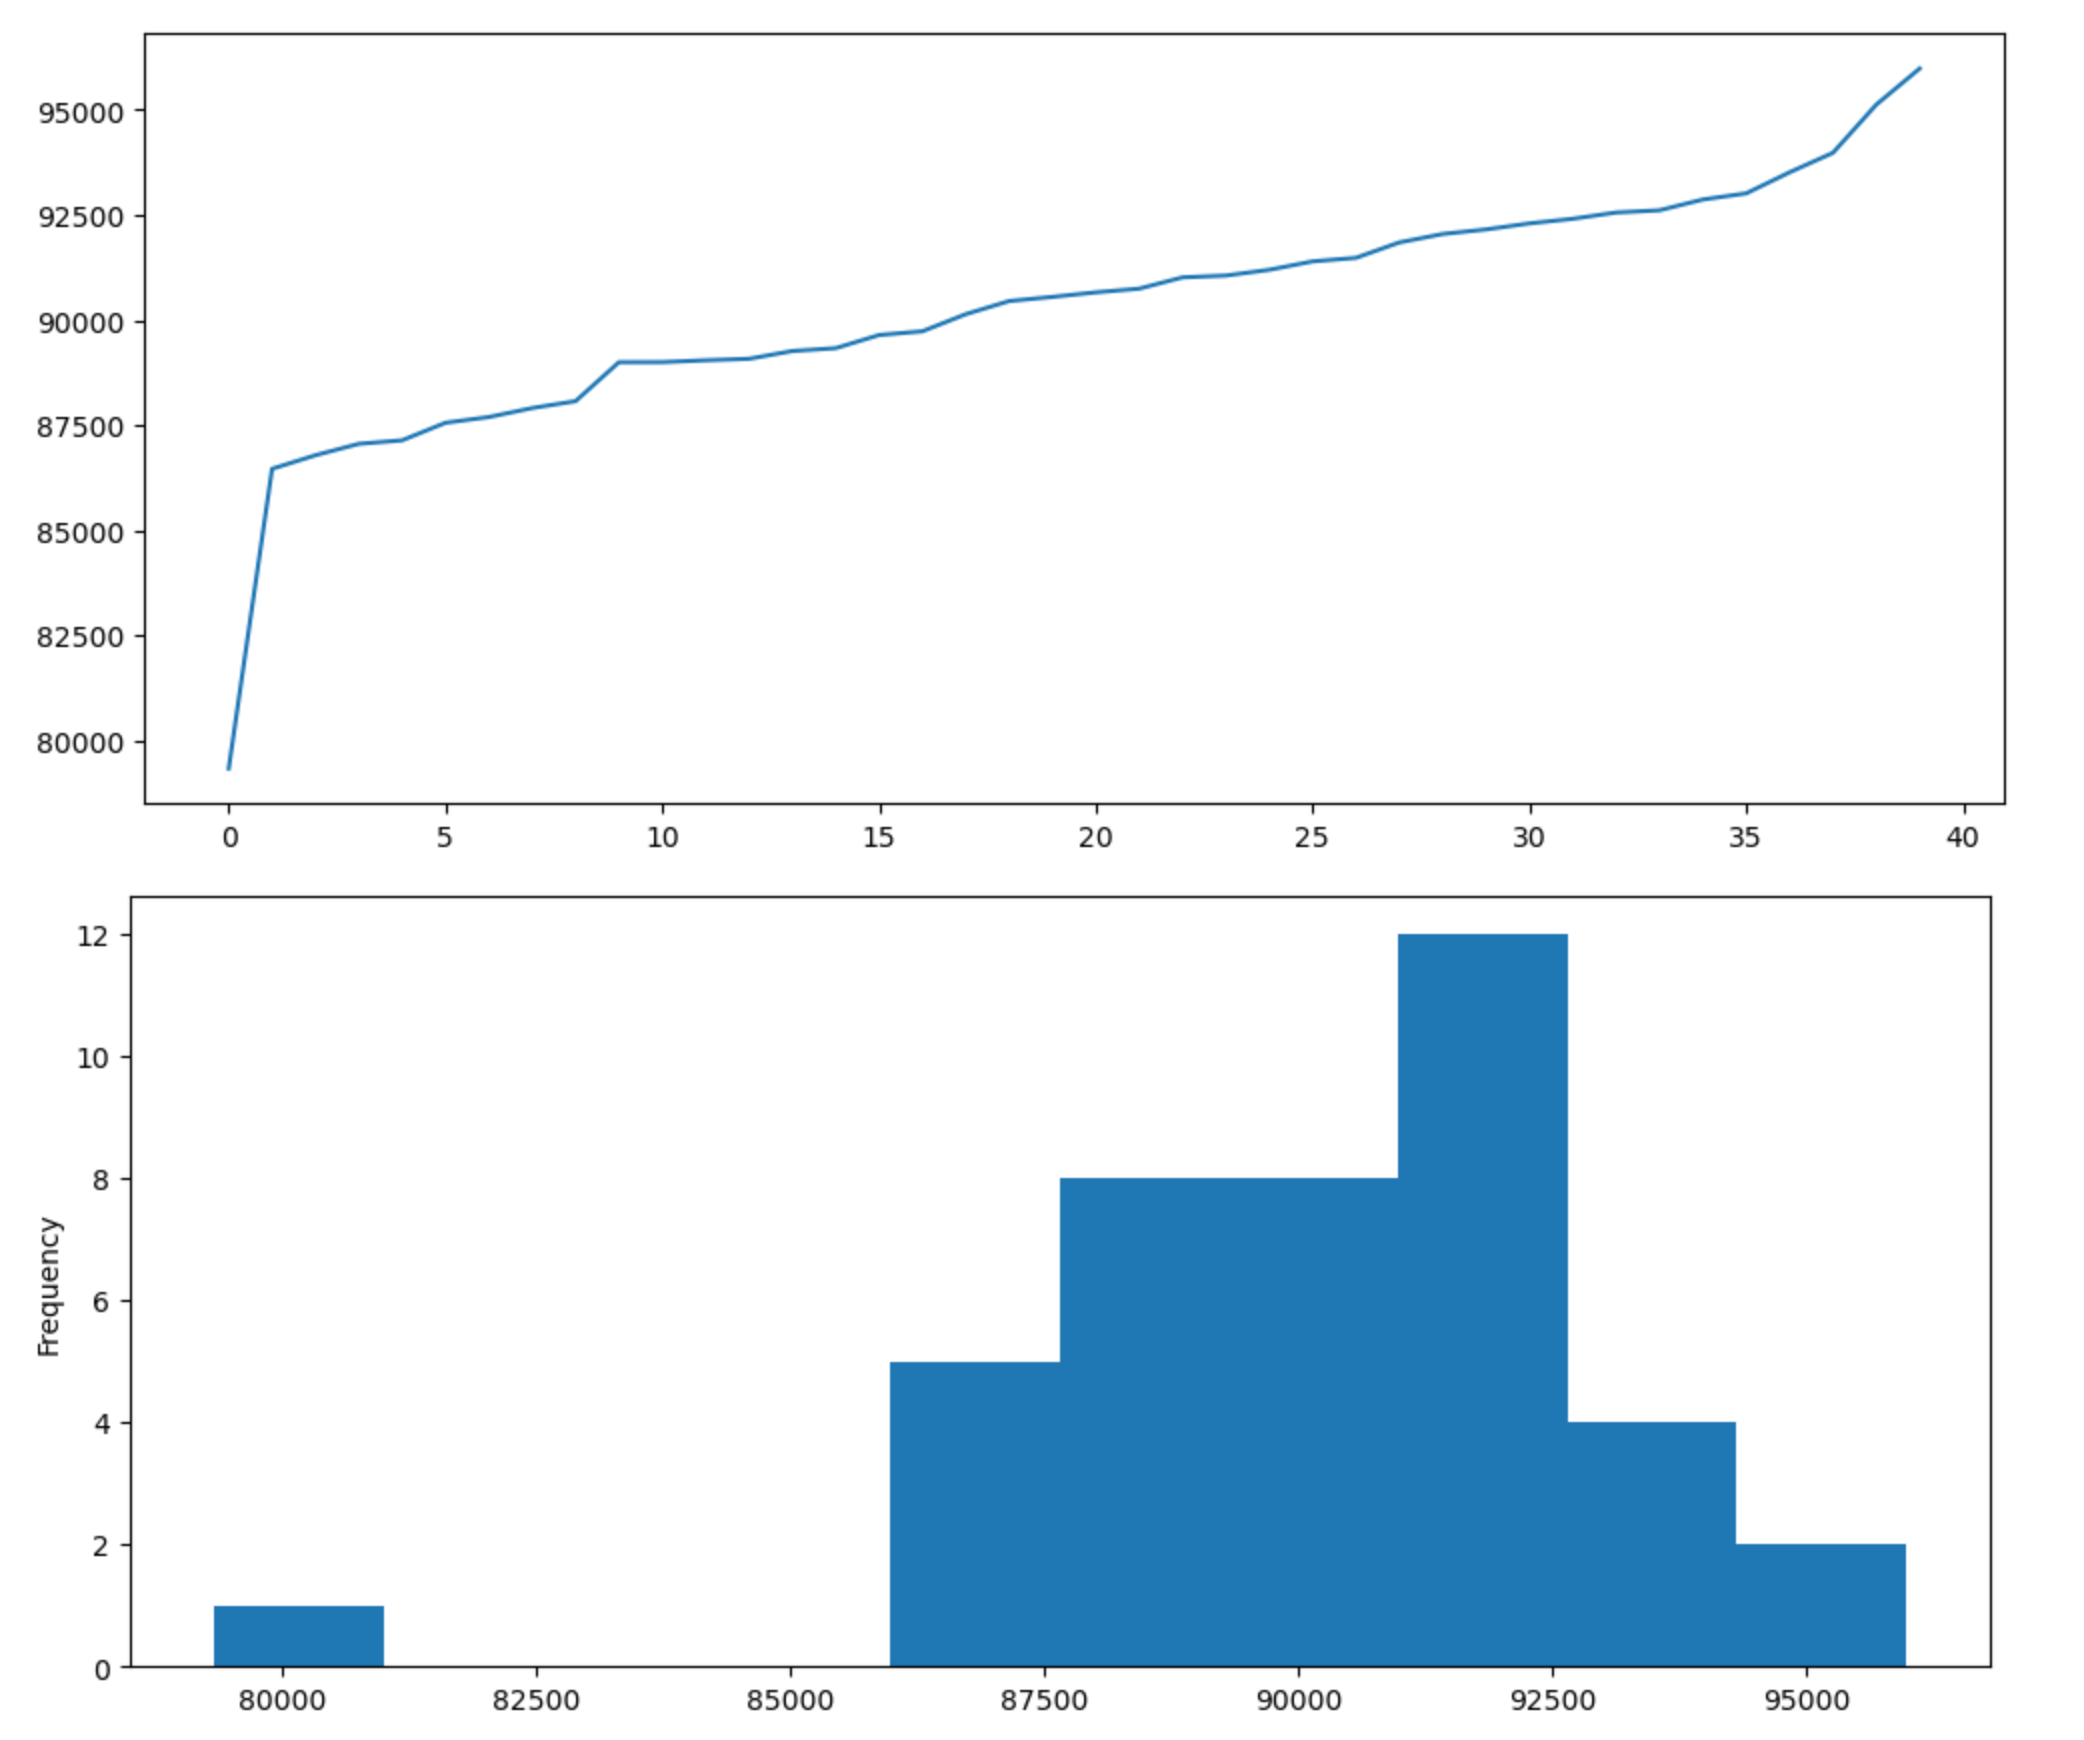
Samples are sorted by throughput, not chronologically.
Something is clearly wrong. It looks like there is some modes in the results, with one run catching the lower performance mode while the other caught the high performance mode. If the samples were independently sampled from the same distribution, this should be a very unlikely outcome.
To get some more clarity I collected some more samples of the same configuration point across all the four nodes I have available. For this data set I increased the ramp time to 60 seconds and the data collection time to 300 seconds, hoping to remove any noise by increasing the experiment duration:
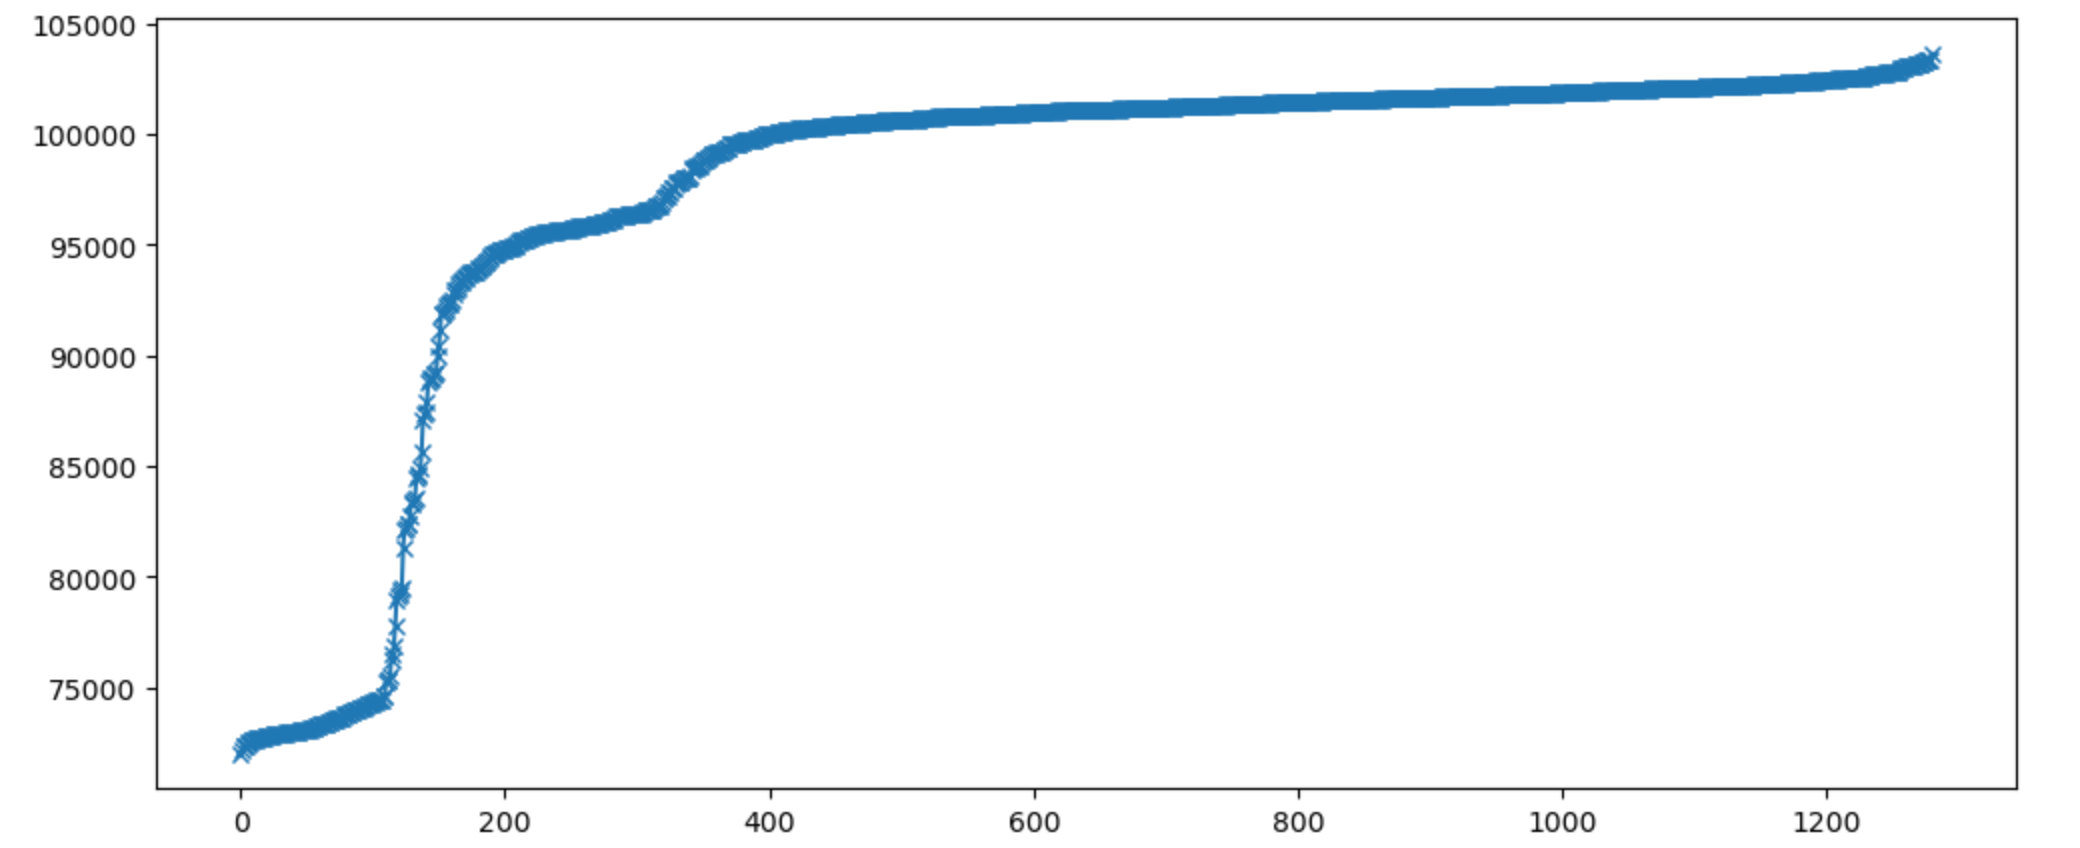
The modes in the output is clearly visible here. It looks like there is three normally distributed chunks in there.
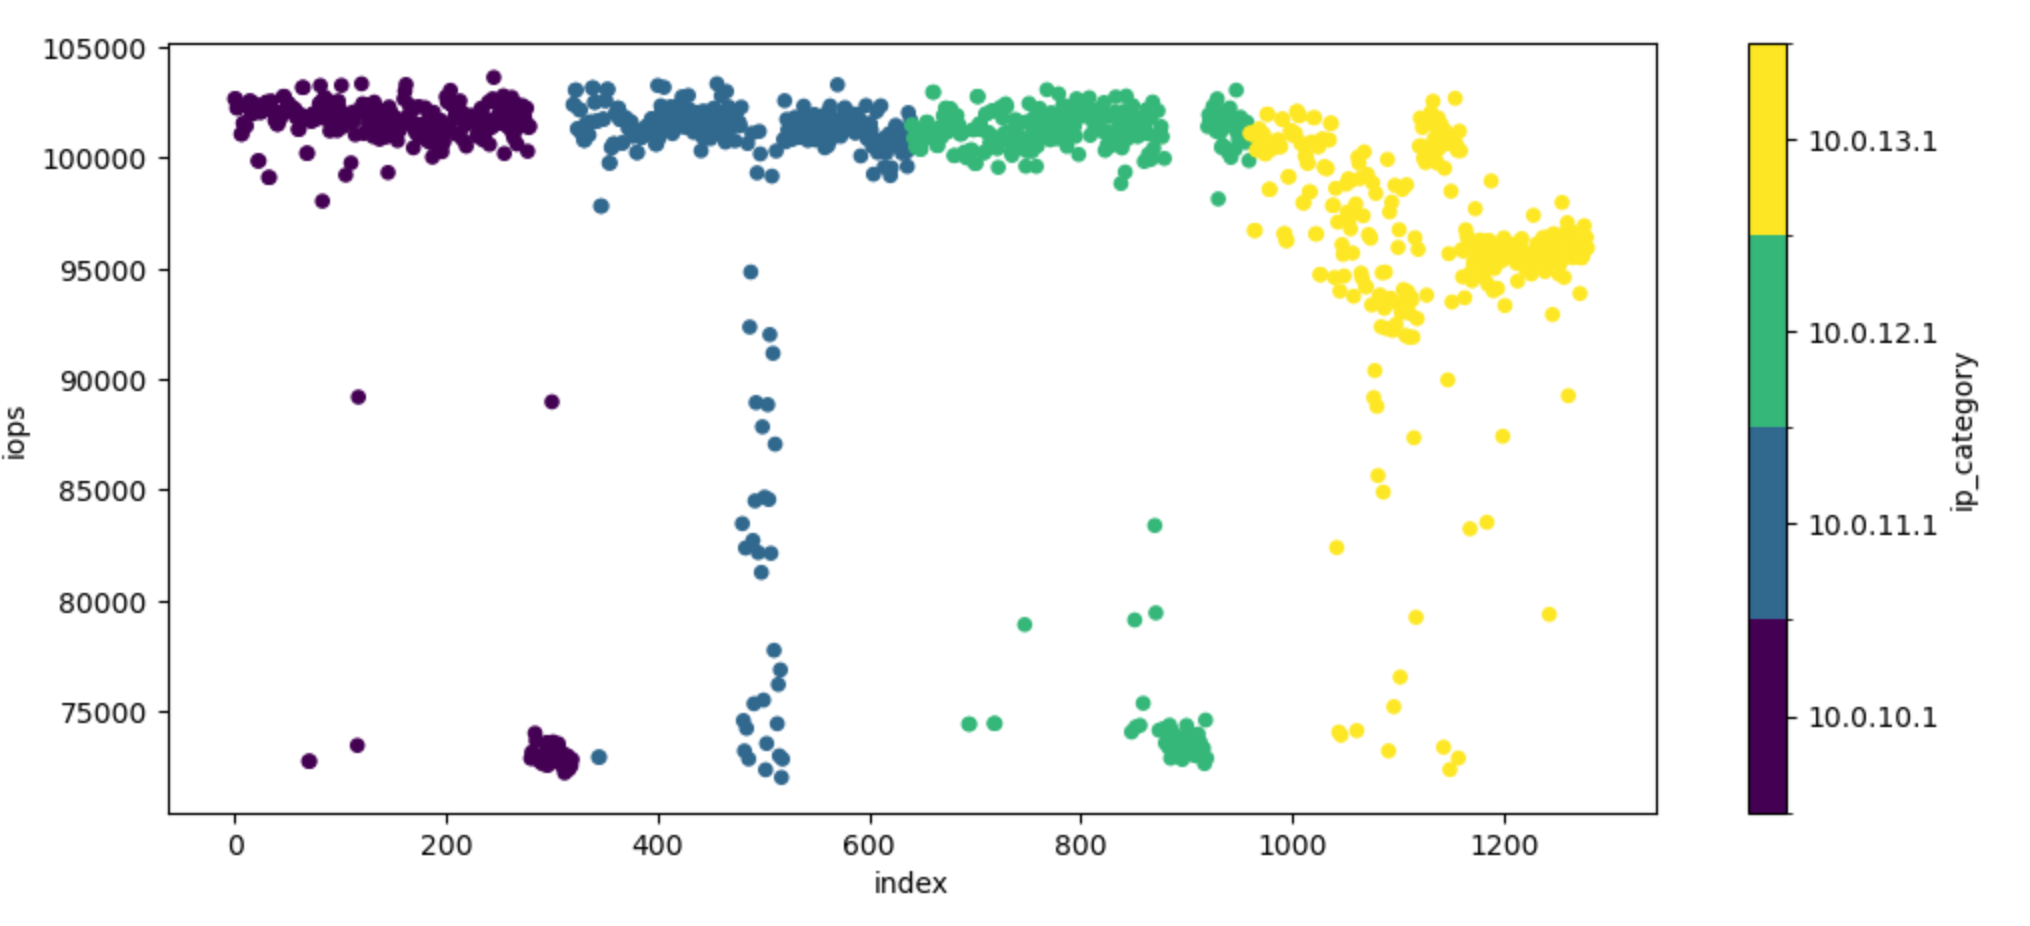
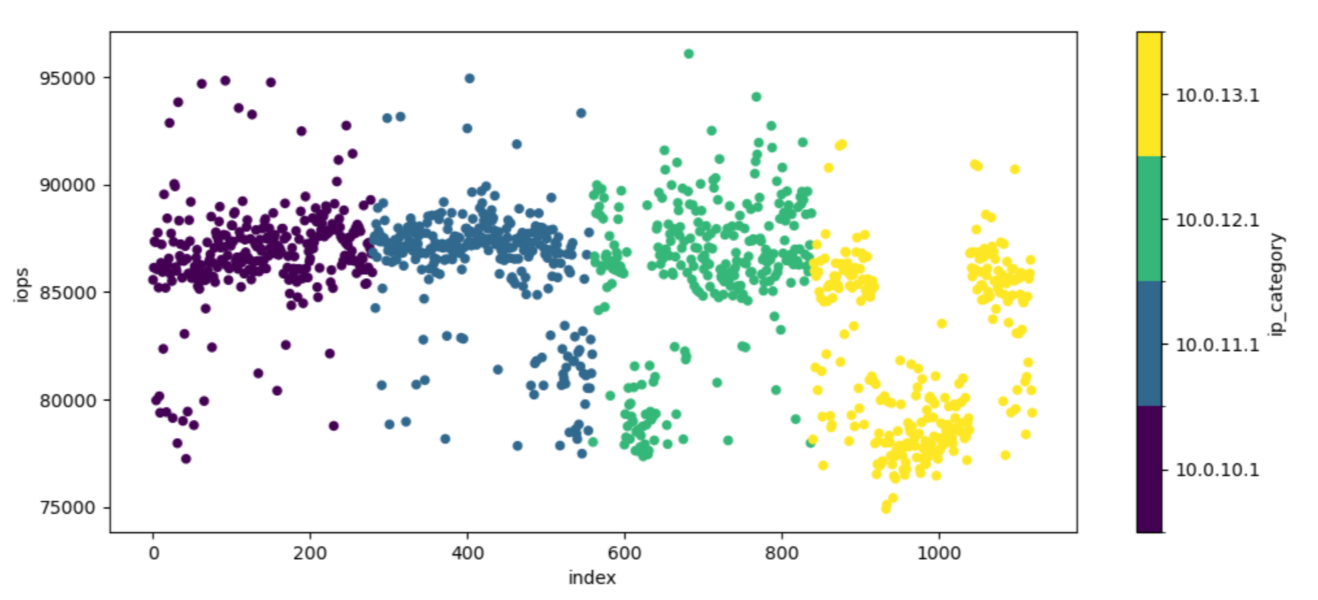
To get a bit of clarity, I colored the samples by the node they were collected on and sorted them by node and collection time:
To decipher this data it helps to know how the data was collected:
- Boot a machine
- Set the
performancegovernor forcpufreq - Loop 40 times:
- Load the
rnull_modmodule, configure for 4 GiB size and enable memory backing - Write 4 GiB of data to the device
- Run a random read workload with 60 second ramp and 300 second measurement
- Unload the
rnull_modmodule
- Load the
- Shut down the machine
I queued the above task 8 times on each available node, resulting in 1280 samples. The clustering visible in the figure corresponds to a single boot of the kernel with 40 samples collected.
From this graph we see that most executions of the workload fall in the 95 to 105 K IO/s range, and from the first plot, each mode seems to follow a normal distribution more or less.
We also see that some executions of the workload cluster around 65K IO/s, and these results tend to be collected from a single boot of the kernel, although not always.
Finally, the node identified by the 10.0.13.1 IP tag has a prominent mode around 95K IO/s which is not observed on the other nodes.
If we plot the data in a histogram, we see this story repeated:
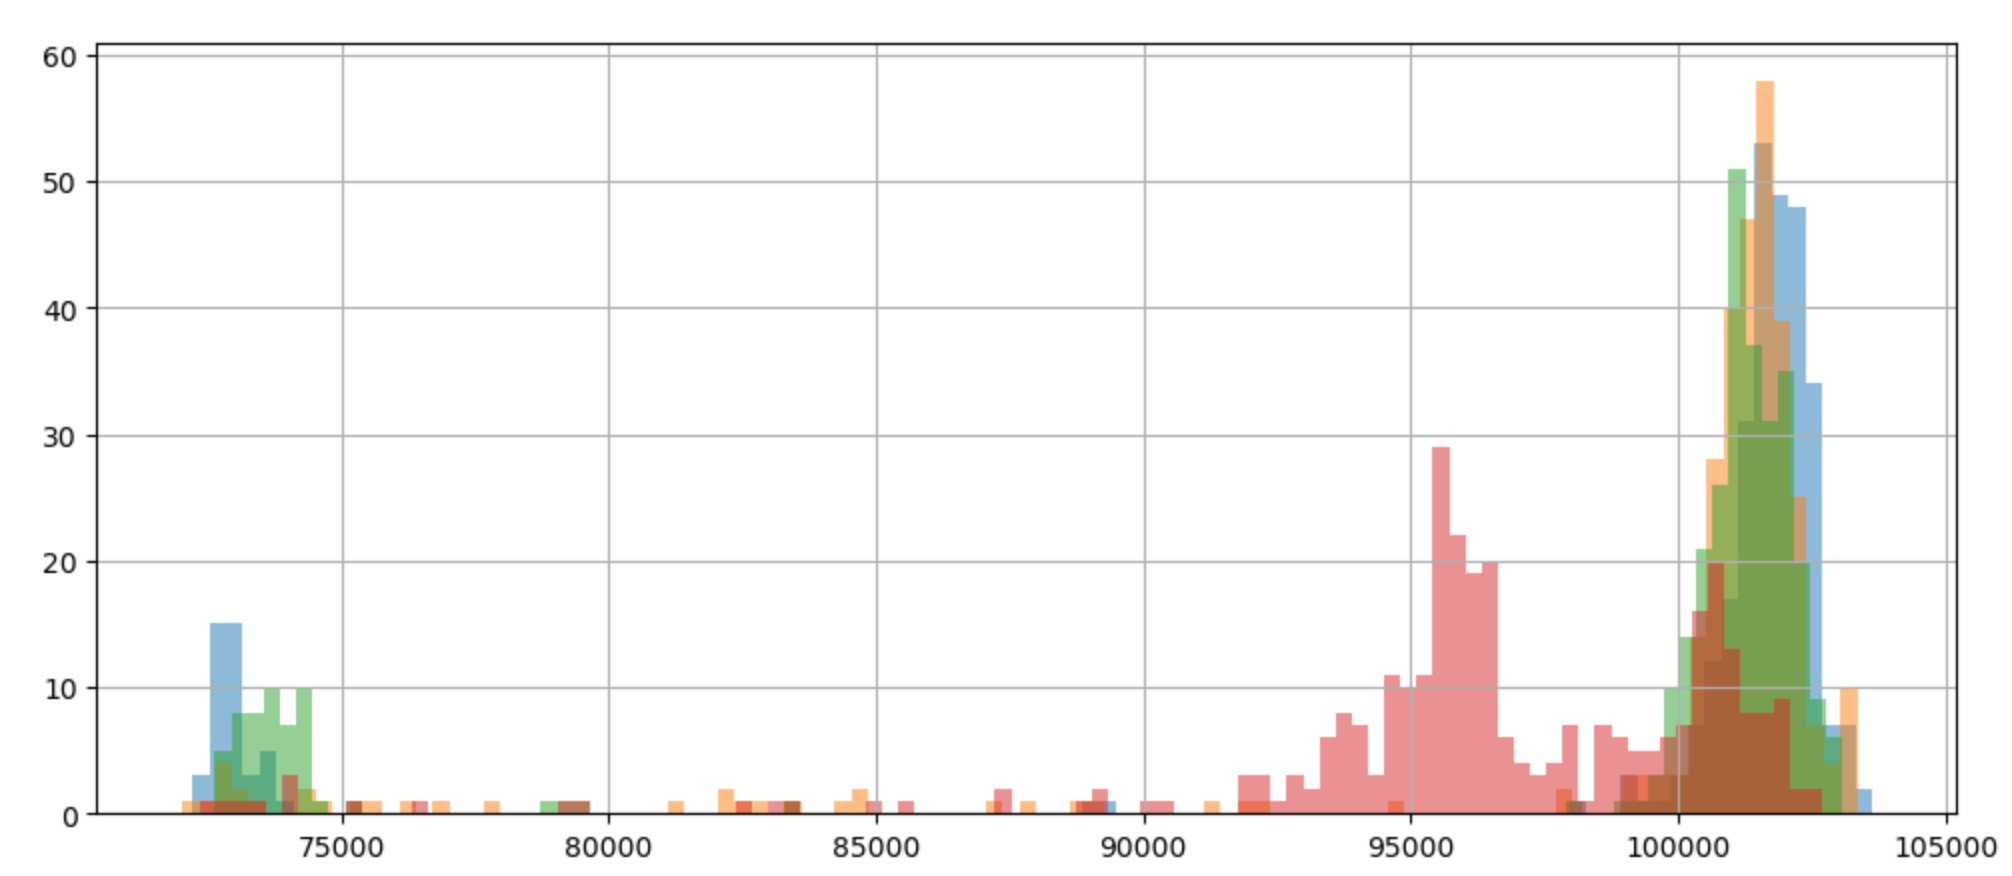
My matplotlib skills did not allow me to match the colors in the histogram to the scatter plot colors. Even though, it is not difficult to distinguish the data from the 10.0.13.1 machine.
Root Cause Analysis
Disabling boost
My first suspect was CPU frequency boost. I thought maybe CPU would be enabling
boost only some times. With boost enabled, CCD temperature was sitting around 40
C and CTL temperature at 45 C. It is worth noting that Linux v6.12-rc2 has a bug
in the amd-pstate-epp driver that causes the non-boost core clock to be
calculated wrong. To mitigate that, I applied this
patch,
which is already in stable v6.12.
I disable boost with:
echo 0 > /sys/devices/system/cpu/cpufreq/boost
I checked that boost is disabled with cpupower:
cpupower frequency-info


analyzing CPU 2:
  driver: amd-pstate-epp
  CPUs which run at the same hardware frequency: 2
  CPUs which need to have their frequency coordinated by software: 2
  maximum transition latency:  Cannot determine or is not supported.
  hardware limits: 400 MHz - 3.80 GHz
  available cpufreq governors: performance powersave
  current policy: frequency should be within 400 MHz and 3.80 GHz.
                  The governor "performance" may decide which speed to use
                  within this range.
  current CPU frequency: Unable to call hardware
  current CPU frequency: 400 MHz (asserted by call to kernel)
  boost state support:
    Supported: yes
    Active: no
    AMD PSTATE Highest Performance: 186. Maximum Frequency: 5.17 GHz.
    AMD PSTATE Nominal Performance: 122. Nominal Frequency: 3.80 GHz.
    AMD PSTATE Lowest Non-linear Performance: 96. Lowest Non-linear Frequency: 2.99 GHz.
    AMD PSTATE Lowest Performance: 13. Lowest Frequency: 400 MHz.
Monitoring cpu frequency during benchmark execution with
s-tui shows the CPUs running at 3769.1
MHz, which is reasonably close the specified nominal frequency of 3.8 GHz. With
this configuration, cores were sitting around 30 C CCD and 40 C CTL temperature
when running the workload.
Rerunning the workload under this configuration lowers the maximum throughput as expected, but the distribution of the result is still similar to the results I got with boost enabled.
Clocking down
Even though CPU temperatures were quite low with boost disabled, I decided to
limit the CPU frequency to 3 GHz. From the amd-pstate
documentation I deduce
the following method to cap the core frequency:
for p in `ls /sys/devices/system/cpu/cpufreq/policy*/scaling_max_freq`; do
  echo 3000000 > $p
done
Again, verifying the CPU frequency clock with s-tui shows that the CPU
frequency is capped. They do not hit 3 GHz, but rather sit around just below
around 2.95 GHz. The frequency moves around +- 10 MHz around this limit. Good
enough.
With this limitation in place, CPU CCD temperature does not change and keeps the 30 C. Again, the throughput is lowered, but still exhibits the same strange multi modal qualities.
Is it fio?
Of course it is not fio. But just to rule it out, I spent a day writing a
workload generator that would generate a workload similar to what fio is
generating. The tool is very simple at ~330 lines of rust
code. It gave the same results as
fio.
Is it memory allocation?
Could it be that the backing memory for the null block device is some times
allocated in a way that limits performance? To investigate this, I ran a
workload that would load the module and allocate the backing
memory once. After this, the I ran the random read workload repeatedly. The
result was similar to reloading and reallocating the backing memory between each
execution of the fio random read workload. Thus, we can eliminate that memory
allocation is the culprit.
Does the C driver experience this issue?
It would be nice to know if the behavior I am observing is inherent to the Rust driver, or if it also occurs for the C driver. To get an answer for this, I used the automated setup to run the same workload that I used for the Rust driver at QD8, 2 jobs, 256 KiB IO size, random read. I collected 1280 samples spread on 4 physical machines with 8 boots of the kernel per machine:
Again, looking at the data in a scatter plot and coloring each data point by the machine it was collected from raises more questions than it answers:
Plotting the data in a histogram shows the two modes clearly:
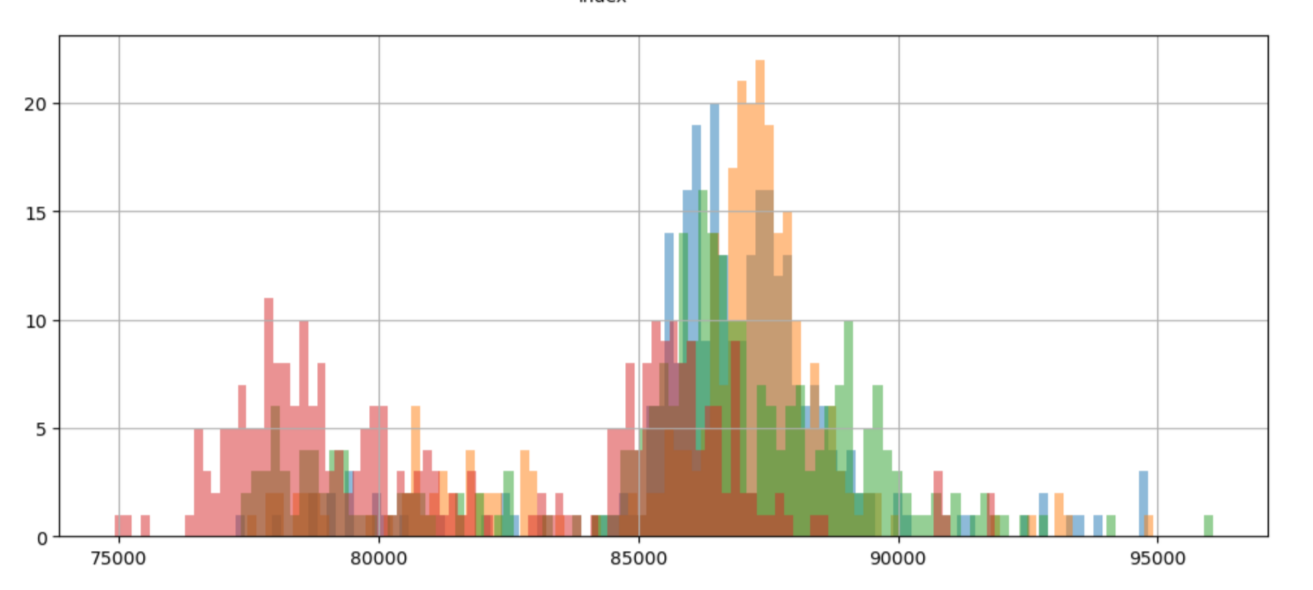
This means that the problem is not related to my rust driver, which is good. But it does not take me much closer to find the root cause.
Manual inspection
At this point I was getting a bit desperate. I decided to drop all the automated
tools I have for running the workloads and get a shell on one of the test
machine to poke around. One observation I made is the following. I load the
rnull_mod module and allocate the backing data by writing to the entire block
device. I then start the random read workload.
- If performance settles at the high mode during the first few seconds, it will most likely stay there.
- If it settles in the low mode, it will most likely stay there.
- It seems like the settling into a performance mode is not random. At certain times the system has more tendency to settle in one of the two performance modes.
- Once in a while, performance will oscillate between the high and the low mode. This is very rare.
This explains why experimenting with longer ramp times and longer workload is unsuccessful in eliminating the noise in the results.
Wrap up
- Rust
rnullshows multi modal throughput that is not random. - The problem is not related to
rnullas the issue is present in Cnull_blkas well. - The issue is not related to throttling or CPU boost.
- The issue is not related to the workload generator
fio. - The issue is not related to memory layout of the backing memory.
The investigation is ongoing!
Some things that I plan to do to hopefully solve the mystery:
- Profile the workload with
perfsee if there is a difference to be observed between the low and high performance modes. - Run the workload on a machine with a different hardware configuration. Perhaps the issue is inherent the hardware platform.